Interactive Map of Uber Rides
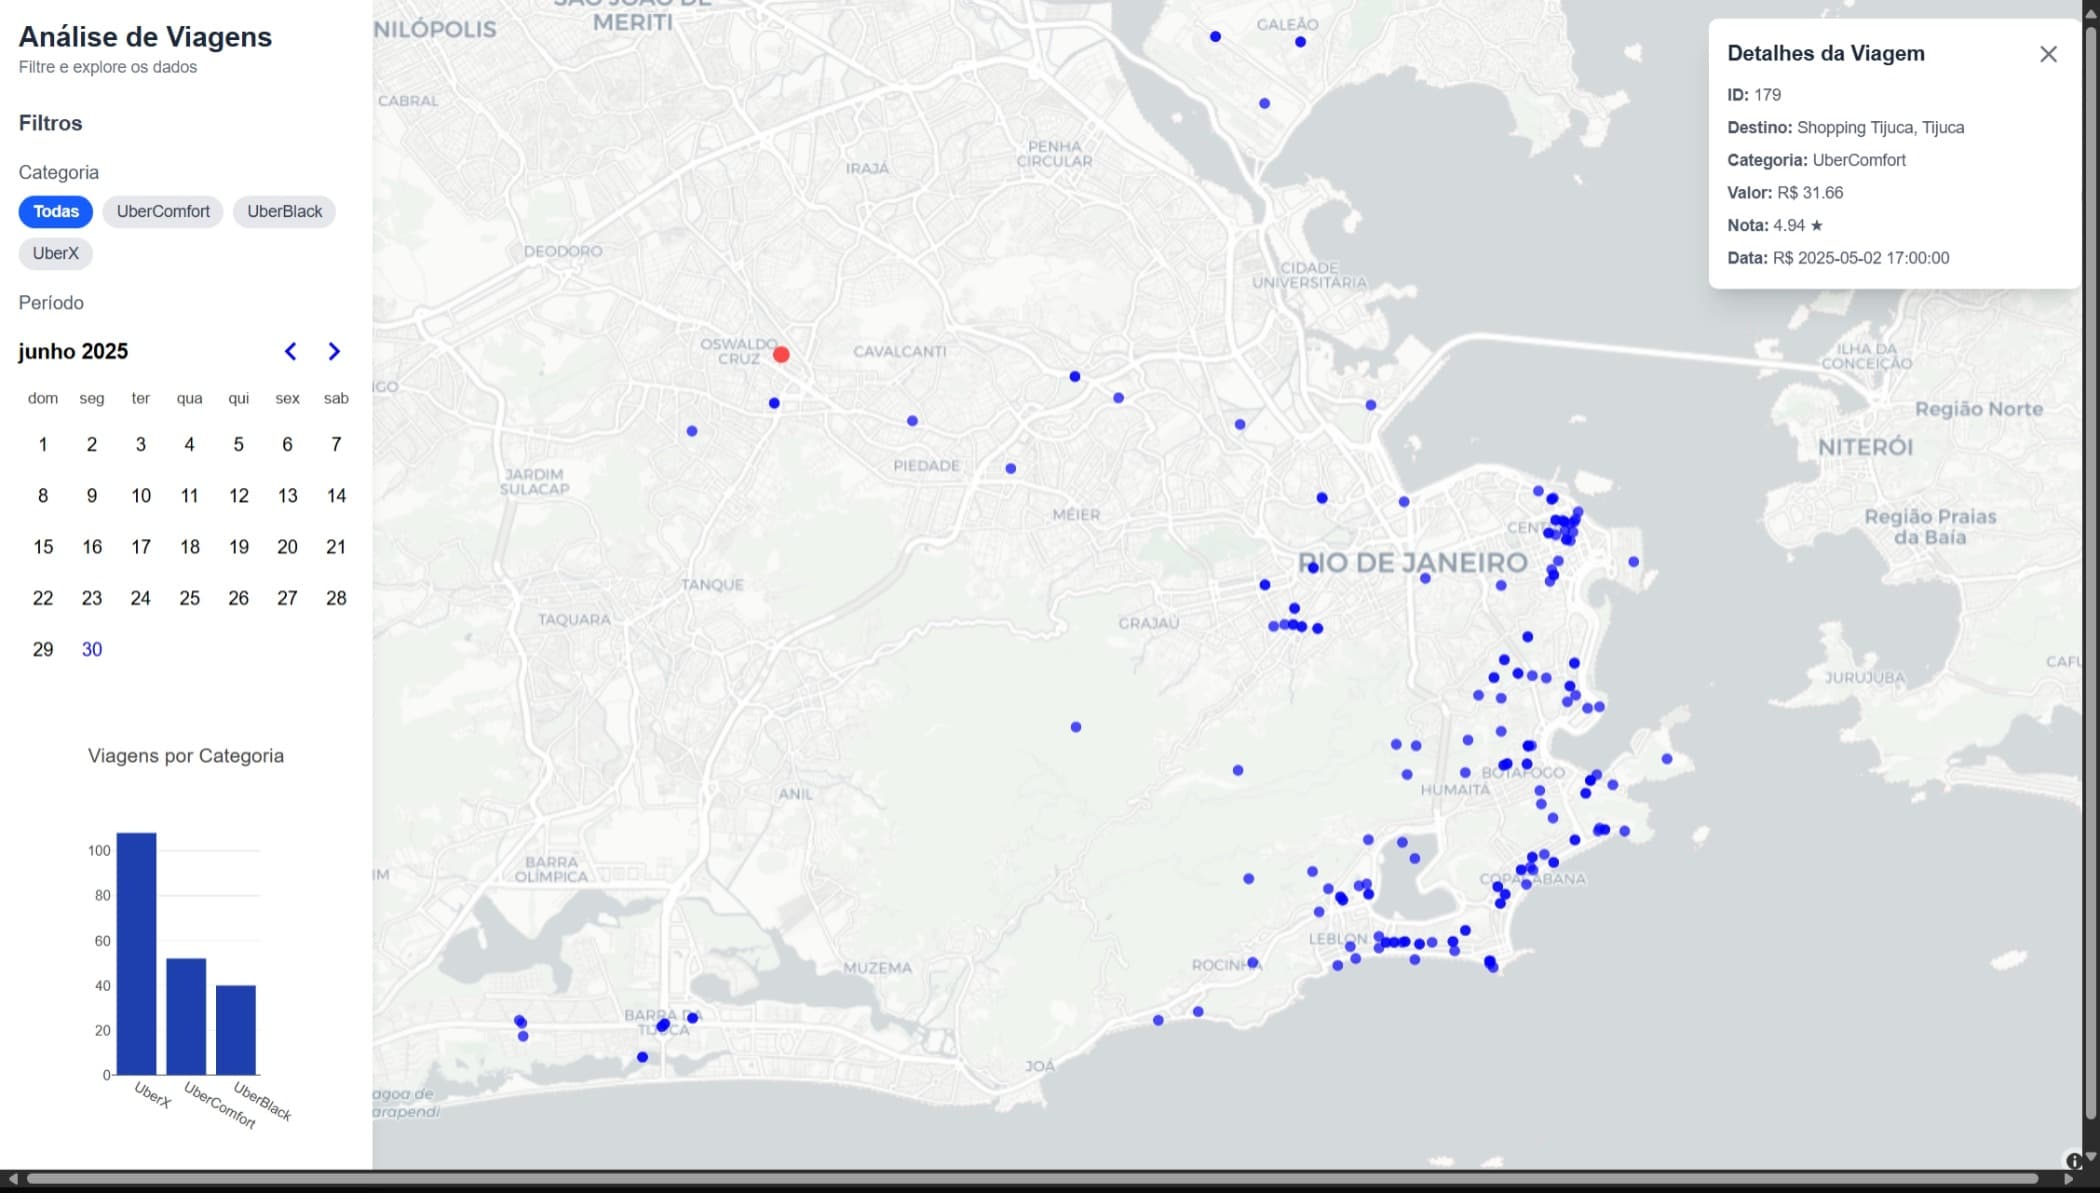
A geospatial data visualization built with React and the Plotly.js library.
Tecnologias Usadas
Next.jsTailwind CSSTypeScriptPlotly.js
A web application built as a Single Page Application (SPA) that consumes data from an API (in this case, local data) to transform information about recorded Uber rides into an interactive and informative map. It allows clear visualization of ride distribution by state, with detailed markers and pop-ups.
The idea is that this map analysis page will, in the future, become one of the main features of my more comprehensive dashboard project, which you can check out here: Dashboard para motorista de aplicativo